Data Insights Plus
Data insights in Agora Analytics offer periodic analysis of call usage and quality data. It helps you understand overall usage and quality trends, map distribution across different dimensions, and provide detailed data for each day, hour, and minute.
The regular version of Data Studio currently supports query analysis of time series graphs and one-dimensional queries. Data Insights Plus offers additional capabilities, including multi-dimensional cross analysis, sampling analysis, comparative analysis, and extended querying of service indicators for Video Calling, , Interactive Live Streaming, and Broadcast Streaming. For a detailed comparison of Agora Analytics Standard and Premium, see pricing.
Want to try out this functionality? There is a 30 day trial period just for you. Please submit a ticket to enroll for the trial.
Project setup
To set up Agora Analytics for your account, take the following steps:
-
Enable Agora Analytics
In pricing, choose the Premium or the Enterprise package and press Subscribe.
Data Insights Plus is activated as soon as you are subscribed.
-
Open Data Insights Plus
- log in to Agora Console.
- In the left menu, click Agora Analytics
- Select Data Insights Plus
-
Select metrics to analyze
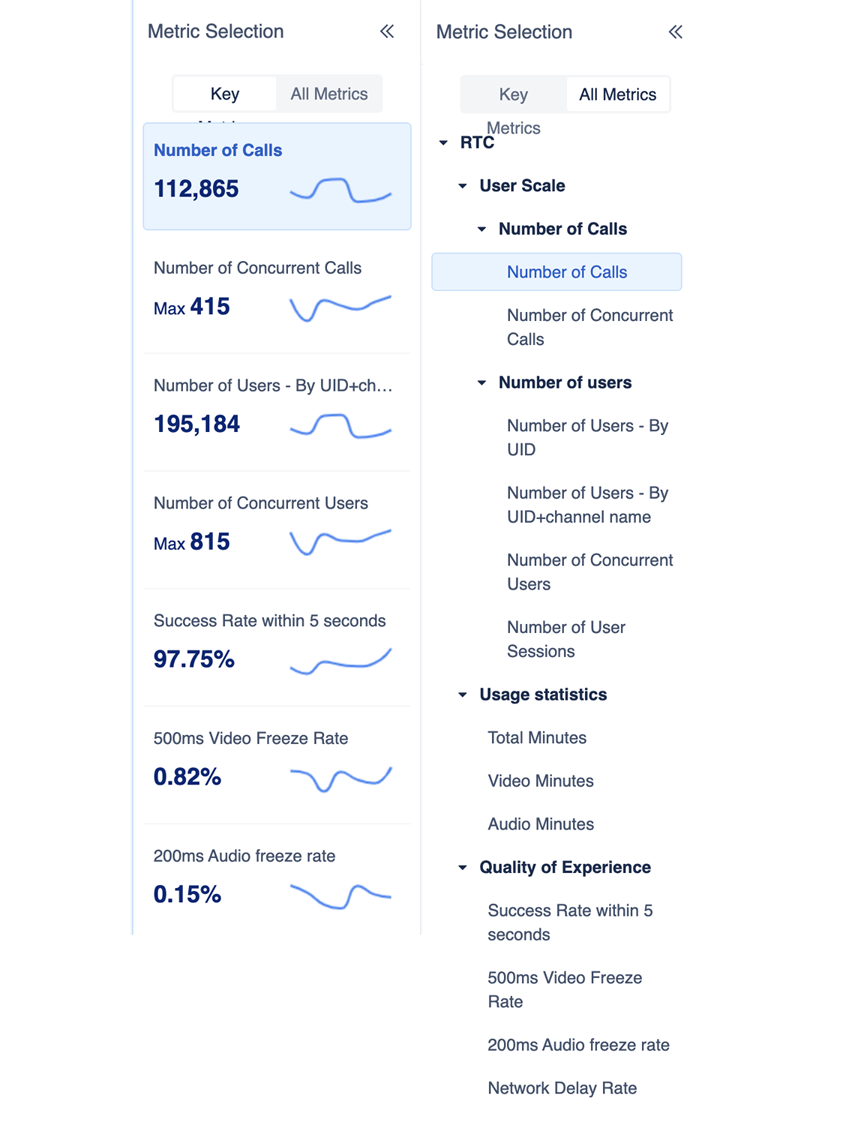
The indicator selection area is located on the left side of the Data Insights page. You click the button in the upper left corner of the page to expand the indicator selection area. Indicator selection is divided into Core indicators and All indicators:
-
The seven Core indicators commonly used in business, are displayed under Core indicators. To the right of the indicator is the thumbnail time series diagram of the corresponding indicator. The default time range is
last week. Hover the mouse over any point on the thumbnail to see the corresponding time point and indicator value. -
All indicators that can be analyzed are listed under All Indicators. Choose an indicator according to the product and your requirements. For an explanation of indicators, other than the core indicators, see Other indicators.
When you click an indicator, it is used as the main analysis indicator for subsequent analysis.
-
-
Set global filters
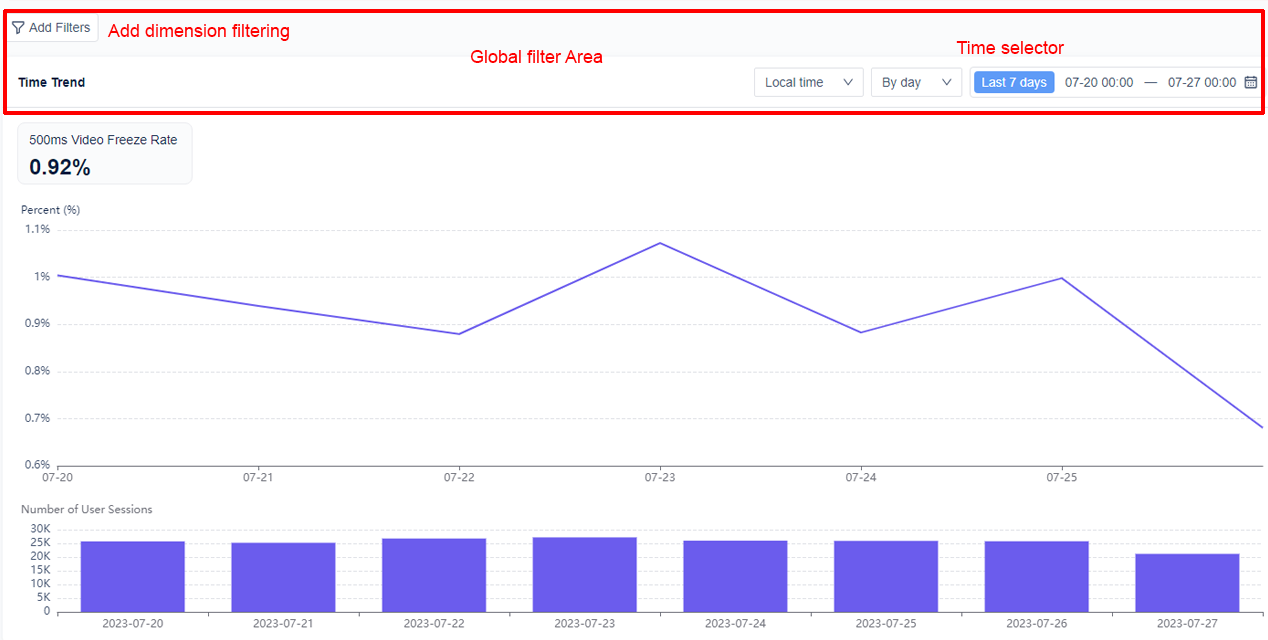
At the top of the Data Studio page is the global filter area. The filter conditions in this area affect the global data on the page.
-
Dimension filtering: Click the Add Filter button on the left to select a dimension in the drop-down box for filtering. Up to three dimensions can be selected at the same time, and the effective range is the time series analysis area and the dimension analysis area. The dimension values in the drop-down box are sorted in descending order of the number of active calls.
-
Time filtering: Use the right side of the global filter area to customize the time range, time granularity (by day/hour) and time zone (local/UTC time). It supports querying data within 90 days. The long query range is 30 days. The time series thumbnail in the indicator selection area depends on the time filter conditions in the global filter.
-
-
Start the analysis
After selecting the indicators to be analyzed and setting the global filter conditions, you view the indicator data in the analysis area on the right and start the analysis. You click the collapse button in the upper right corner to collapse the indicator selection area to focus on the analysis.
Note: The data provided on the Data Insights page is for analysis purposes only, and is not used as the basis for actual billing.
Analyze data usage
Data Insights Plus supports the following analysis methods:
Time series analysis
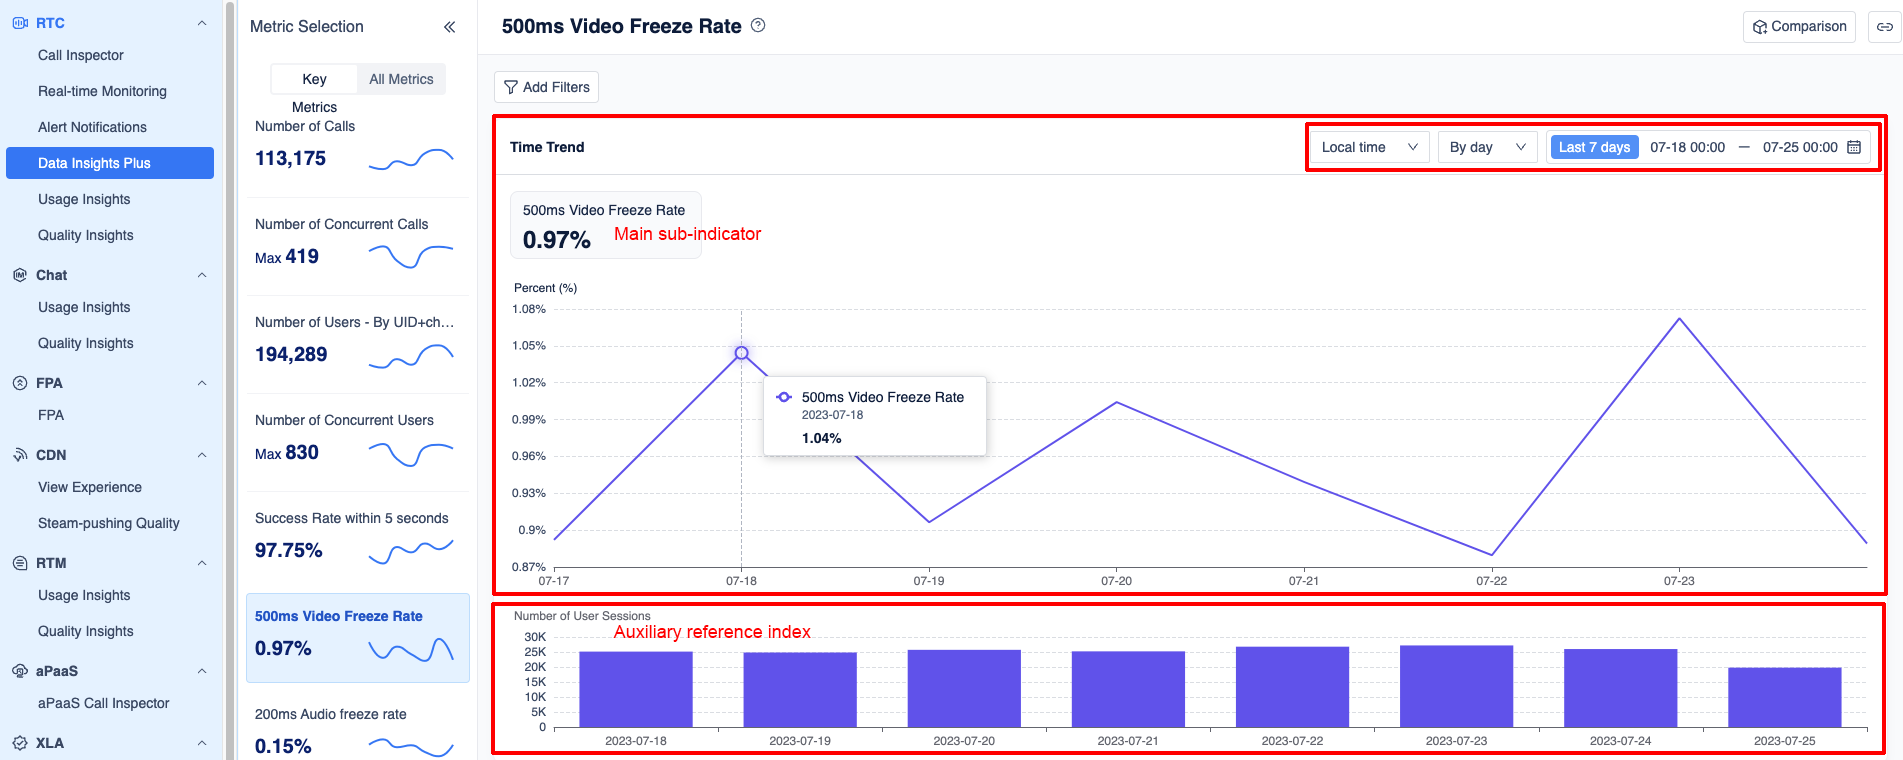
Above the analysis area on the Data Insights page is the time series analysis section, which displays the changes in indicators over time based on the selected conditions.
Timing analysis includes the following functions:
-
Linkage with global filter conditions: The data displayed in the time series analysis chart is generated according to the conditions set in the global filter.
-
Line chart interaction
You interact with the line chart in the following ways:
-
Hover over a data point to display the indicator-dimension group name, timestamp, and indicator value.
-
Click a data point to:
- View hour-level data. Use this point as the data range granularity to switch to a one-hour view.
- Perform dimensional decomposition. Initiate dimensional analysis with this data point.
- Conduct data sampling. Start sampling analysis with this data point. Currently, only the audio freeze rate, video freeze rate, and network transmission delay rate support data sampling.
-
-
Auxiliary reference indicators
The quality experience indicators (success rate of joining channels, audio/video freeze rate, network delay rate) display additional auxiliary reference indicators below the sequence diagram to assist in assessing the validity of the data. Hovering the mouse over the auxiliary indicator column chart reveals the timestamp, indicator/dimension group name, and indicator value corresponding to that specific point in time.
Dimensional analysis
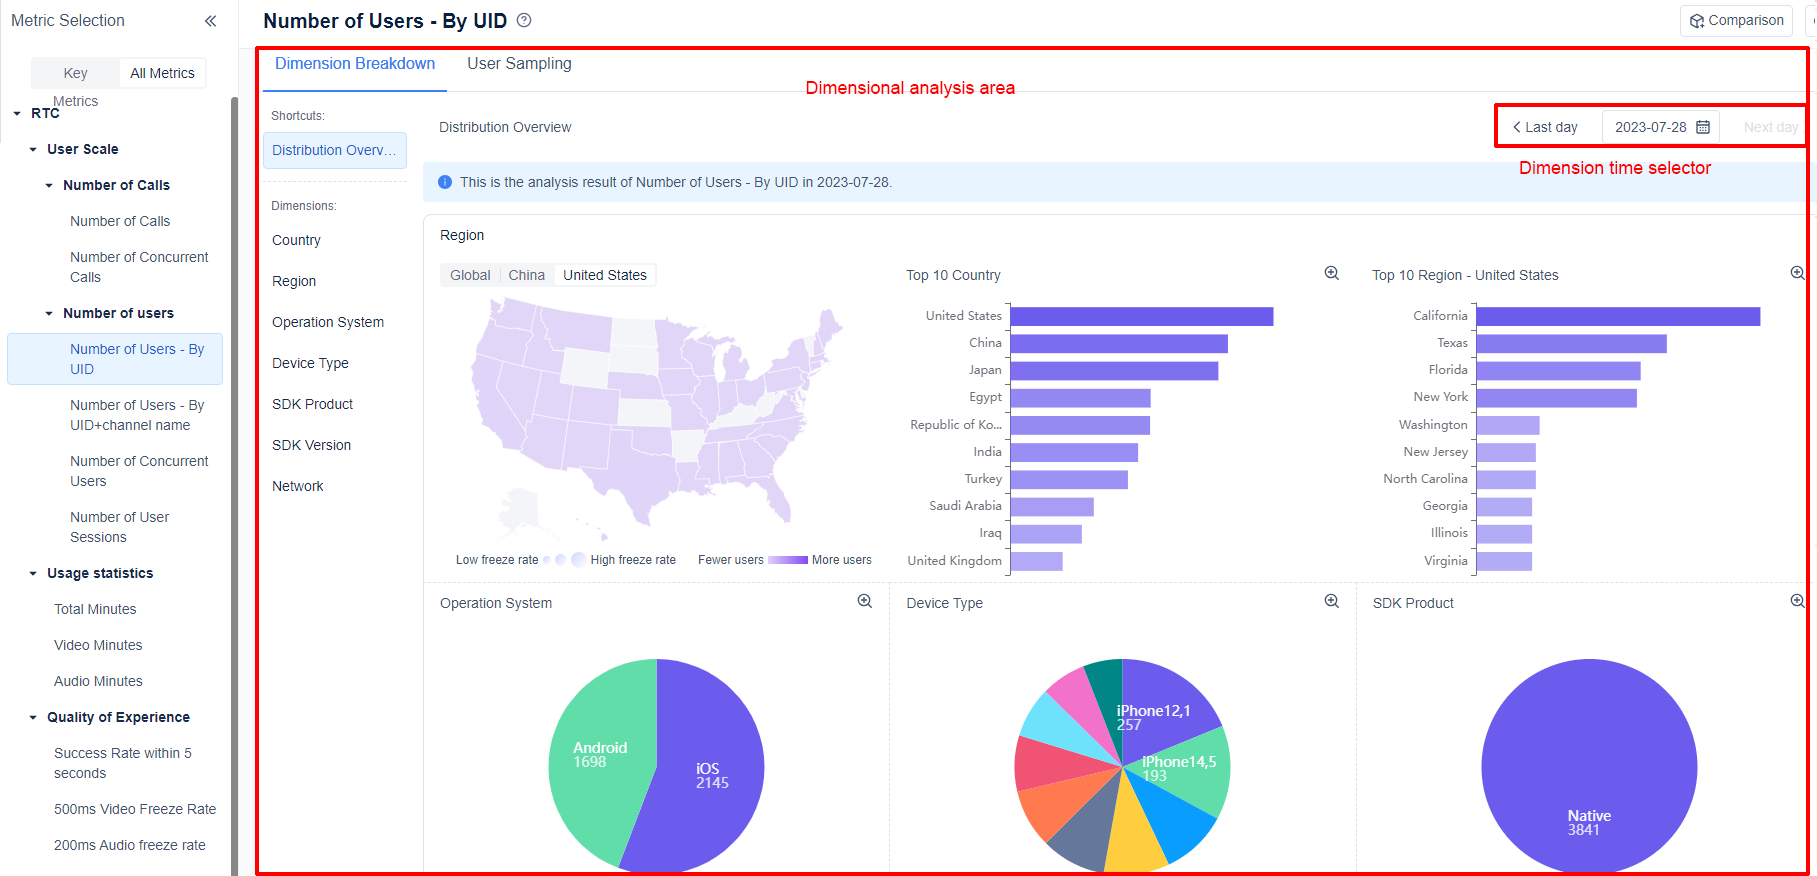
The dimensional analysis area is located below the analysis area on the data insight page. It shows the distribution of selected indicators under each dimension.
Dimensional analysis includes the following capabilities:
-
Dimension Time Picker
- The dimension analysis area features an independent time selector that aligns with the selected time interval in the time series analysis area. It maintains the same time granularity as the data points in the time series analysis.
- By default, when you select a time interval in the time series analysis chart, the dimension analysis displays the result for the last data point within that interval.
- You have the flexibility to manually adjust the time using the dimension time selector. Additionally, clicking a data point in the time series analysis diagram and selecting Dimension Decomposition allows you to view the dimensional analysis results specific to that point.
-
Quick distribution: After you select the main analysis indicator, the dimension analysis area displays several commonly used dimension distribution graphs of the indicator. The dimensions supported by each indicator are different. Explore the display methods of each dimension.
-
One-dimensional analysis: In addition to the quick distribution, the analysis dimensions supported by the selected indicator are displayed on the left side of the dimensional analysis area. When you click a dimension, the analysis result list of this dimension is displayed on the right.
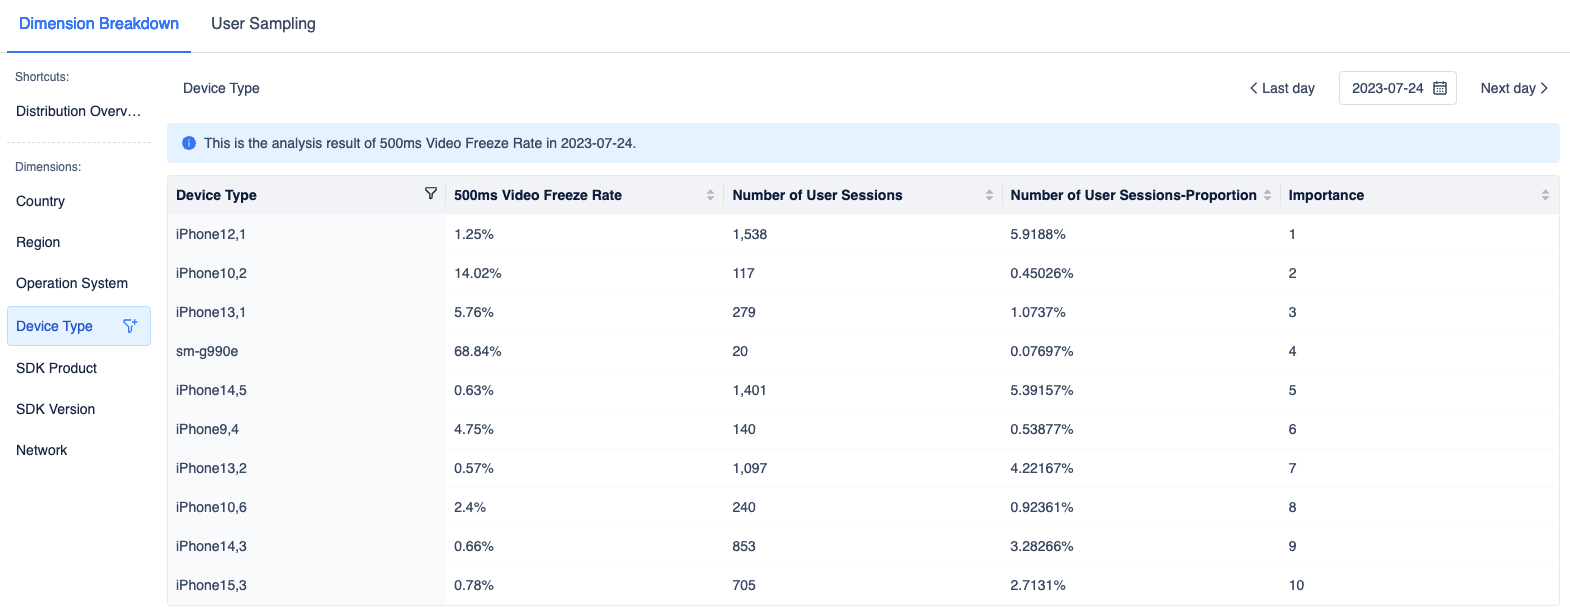
-
Linkage with global filter conditions: The charts in the quick distribution of dimensional analysis and the results of one-dimensional analysis are generated according to the filter conditions set in the global filter.
Sampling analysis
Sampling analysis is only supported when video/audio freeze rate and network transmission delay rate are selected as the main analysis indicators. Click a data point in the time series analysis diagram of these three indicators, and select Data Sampling to sample and analyze the data point.
Sampling analysis includes the following functions:
-
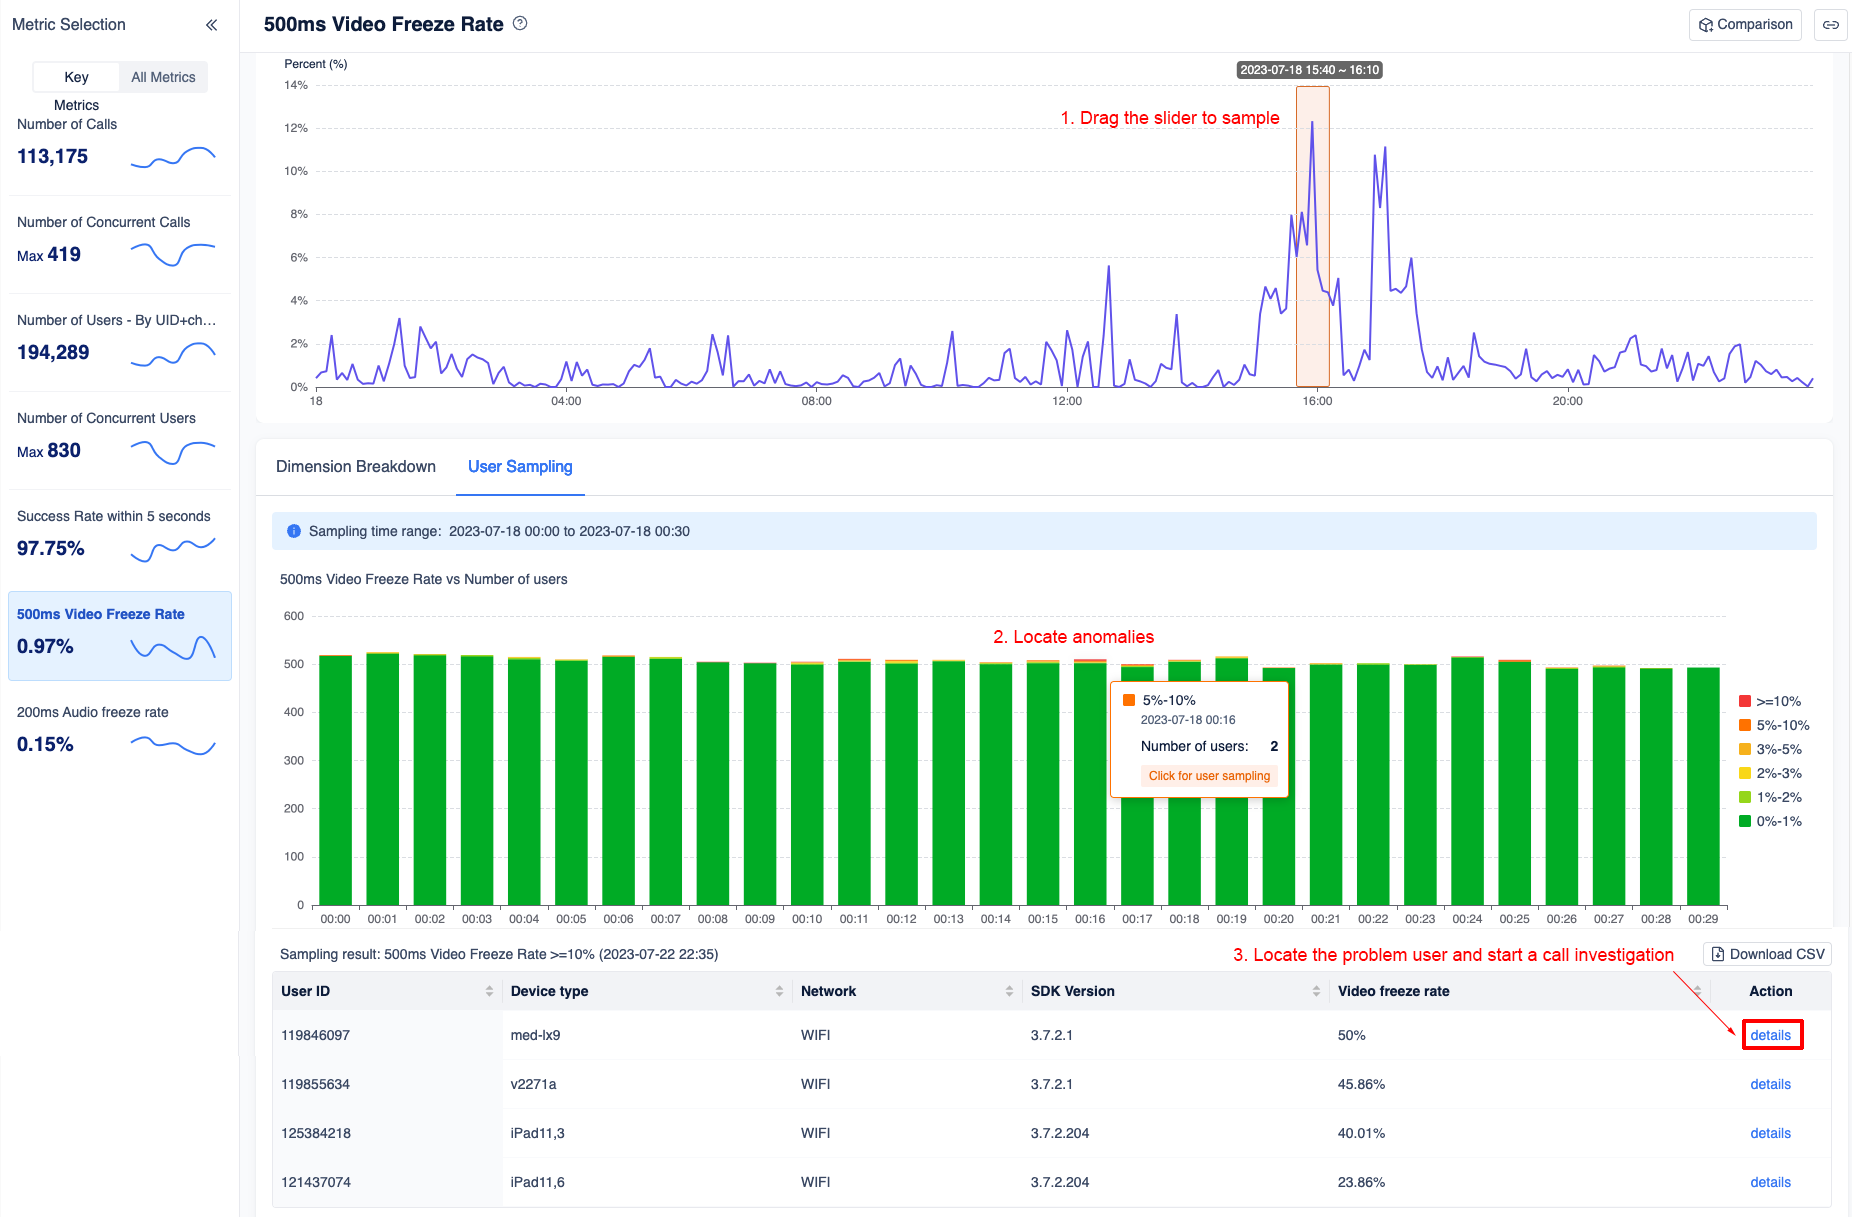
Drag the slider to sample: The orange sampling slider covers a time interval of 30 minutes. When you drag the orange slider to any position on the graph, the indicator changes and gradient distribution during the 30 minute interval is displayed.
-
Stacked column chart: The slider sampling result displays the indicator distribution of the 30 minute interval in the form of a stacked column chart. Click the color block in the column to perform user sampling for this group.
-
User sampling
- When you click the color column, the relevant information of this group of users is displayed in a list including user ID, device type, network type, and other parameters. Up to 500 sets of data can be displayed.
- Click Detailed Information on the right to jump to the Call Survey-Call Details page of the corresponding call.
- Click a header item to sort all results in ascending or descending order based on that item.
Comparative analysis
You find the comparative analysis button in the upper right corner of the analysis area, click and select the desired analysis method to start the comparative analysis.
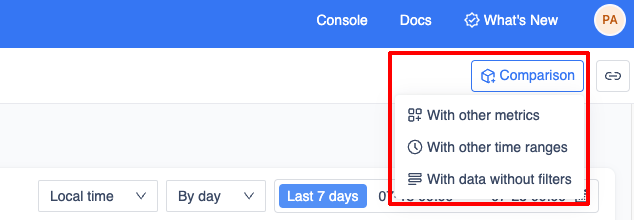
Comparative analysis supports the following methods:
Indicator comparison
Indicator comparison allows you to analyze and compare the changing trends of different indicators within the same time period.
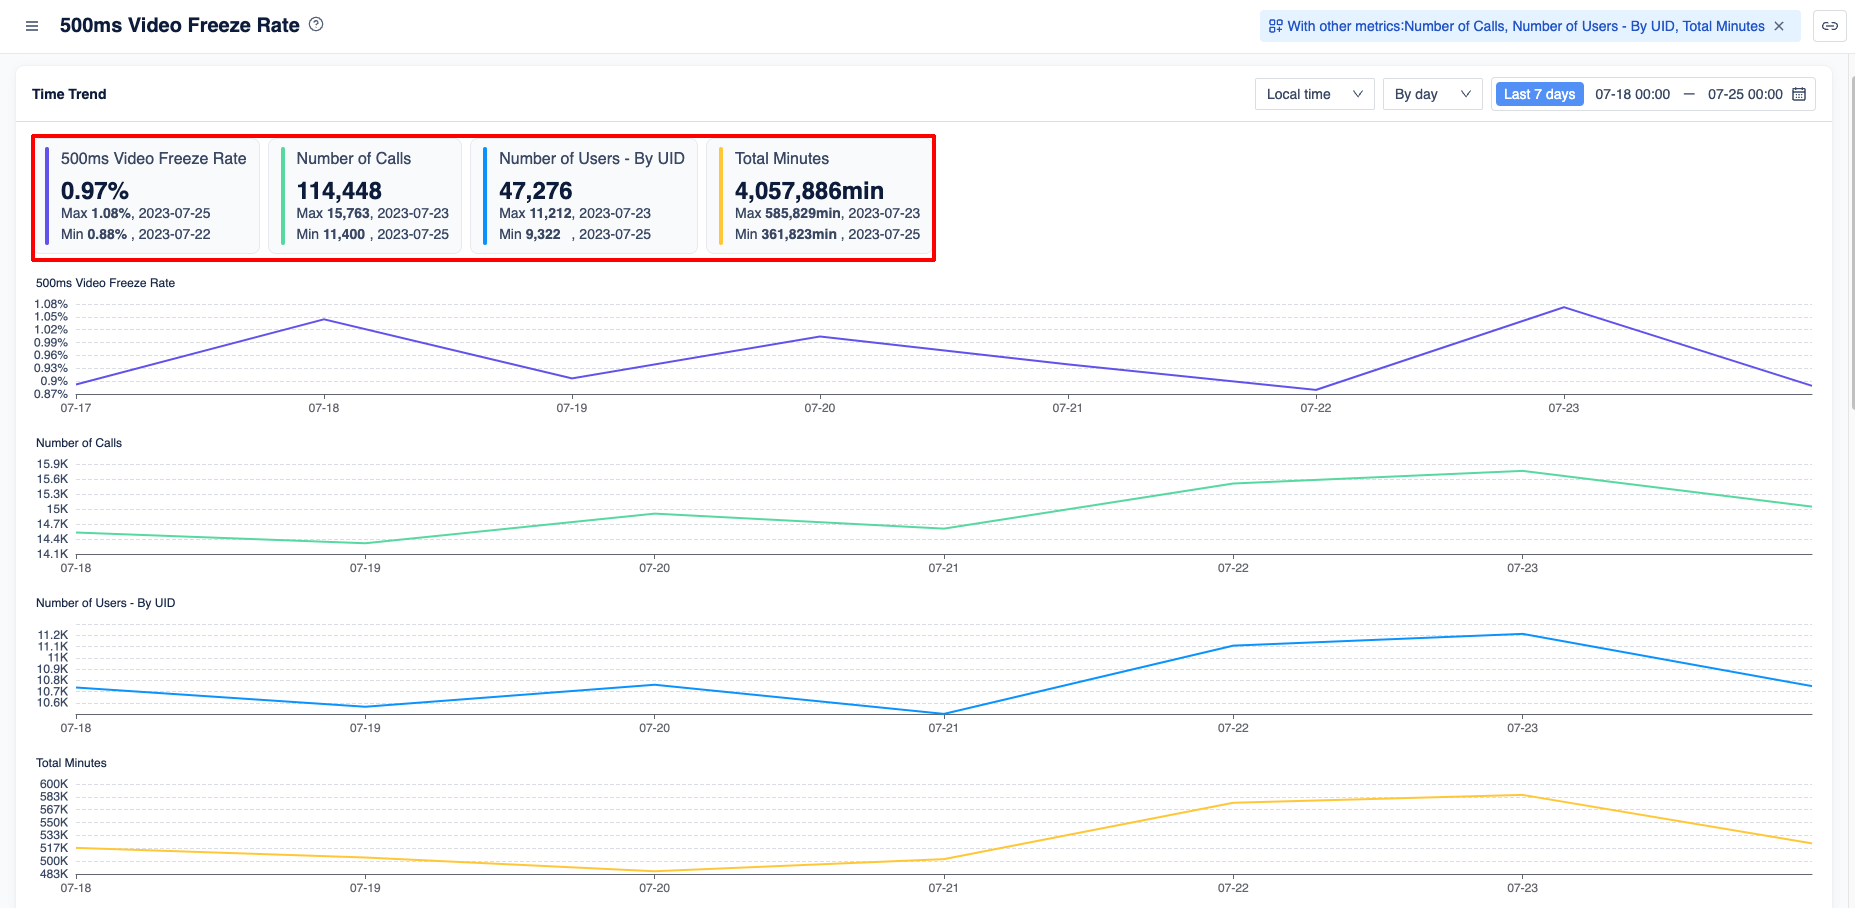
Consider the following when using this feature:
- You can select up to 3 indicators to compare with the main analysis indicators.
- When multiple indicators are selected and applied, the dimension global filter conditions will be cleared to initialize the comparison mode. You can then add dimension global filter conditions again.
- After selecting and applying multiple indicators, the time series analysis area will display a multi-indicator time series diagram. The dimension analysis area will present dimensional data corresponding to the selected multiple indicators for single-dimensional analysis.
Time comparison
Time comparison is utilized to compare the data performance and change trend of the same indicator across different time periods.
The time comparison method supports the following selection modes:
- Comparison with the previous cycle: Compares the data from the previous 14-day cycle.
- Compare with last month: Compares the data from the corresponding period in the previous month.
- Custom time: Allows you to choose a comparison period based on your preference. The granularity is in days, and the number of days selected should match the current time period.
Ensure that the start time of all comparison time periods does not precede the earliest query time permitted by your package.
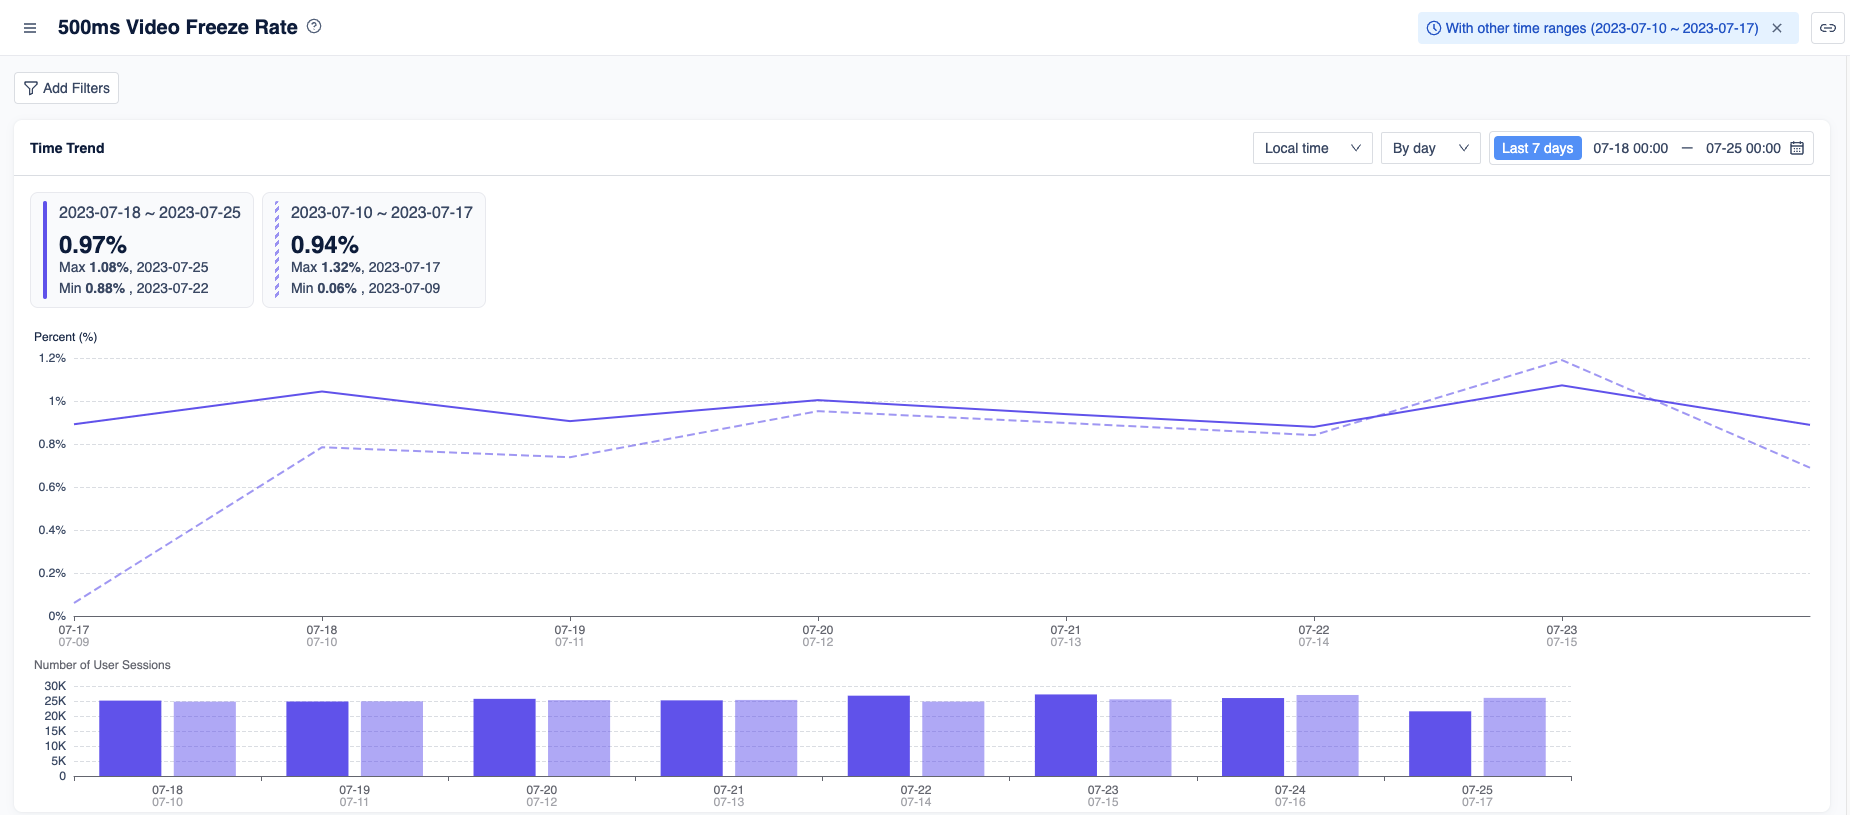
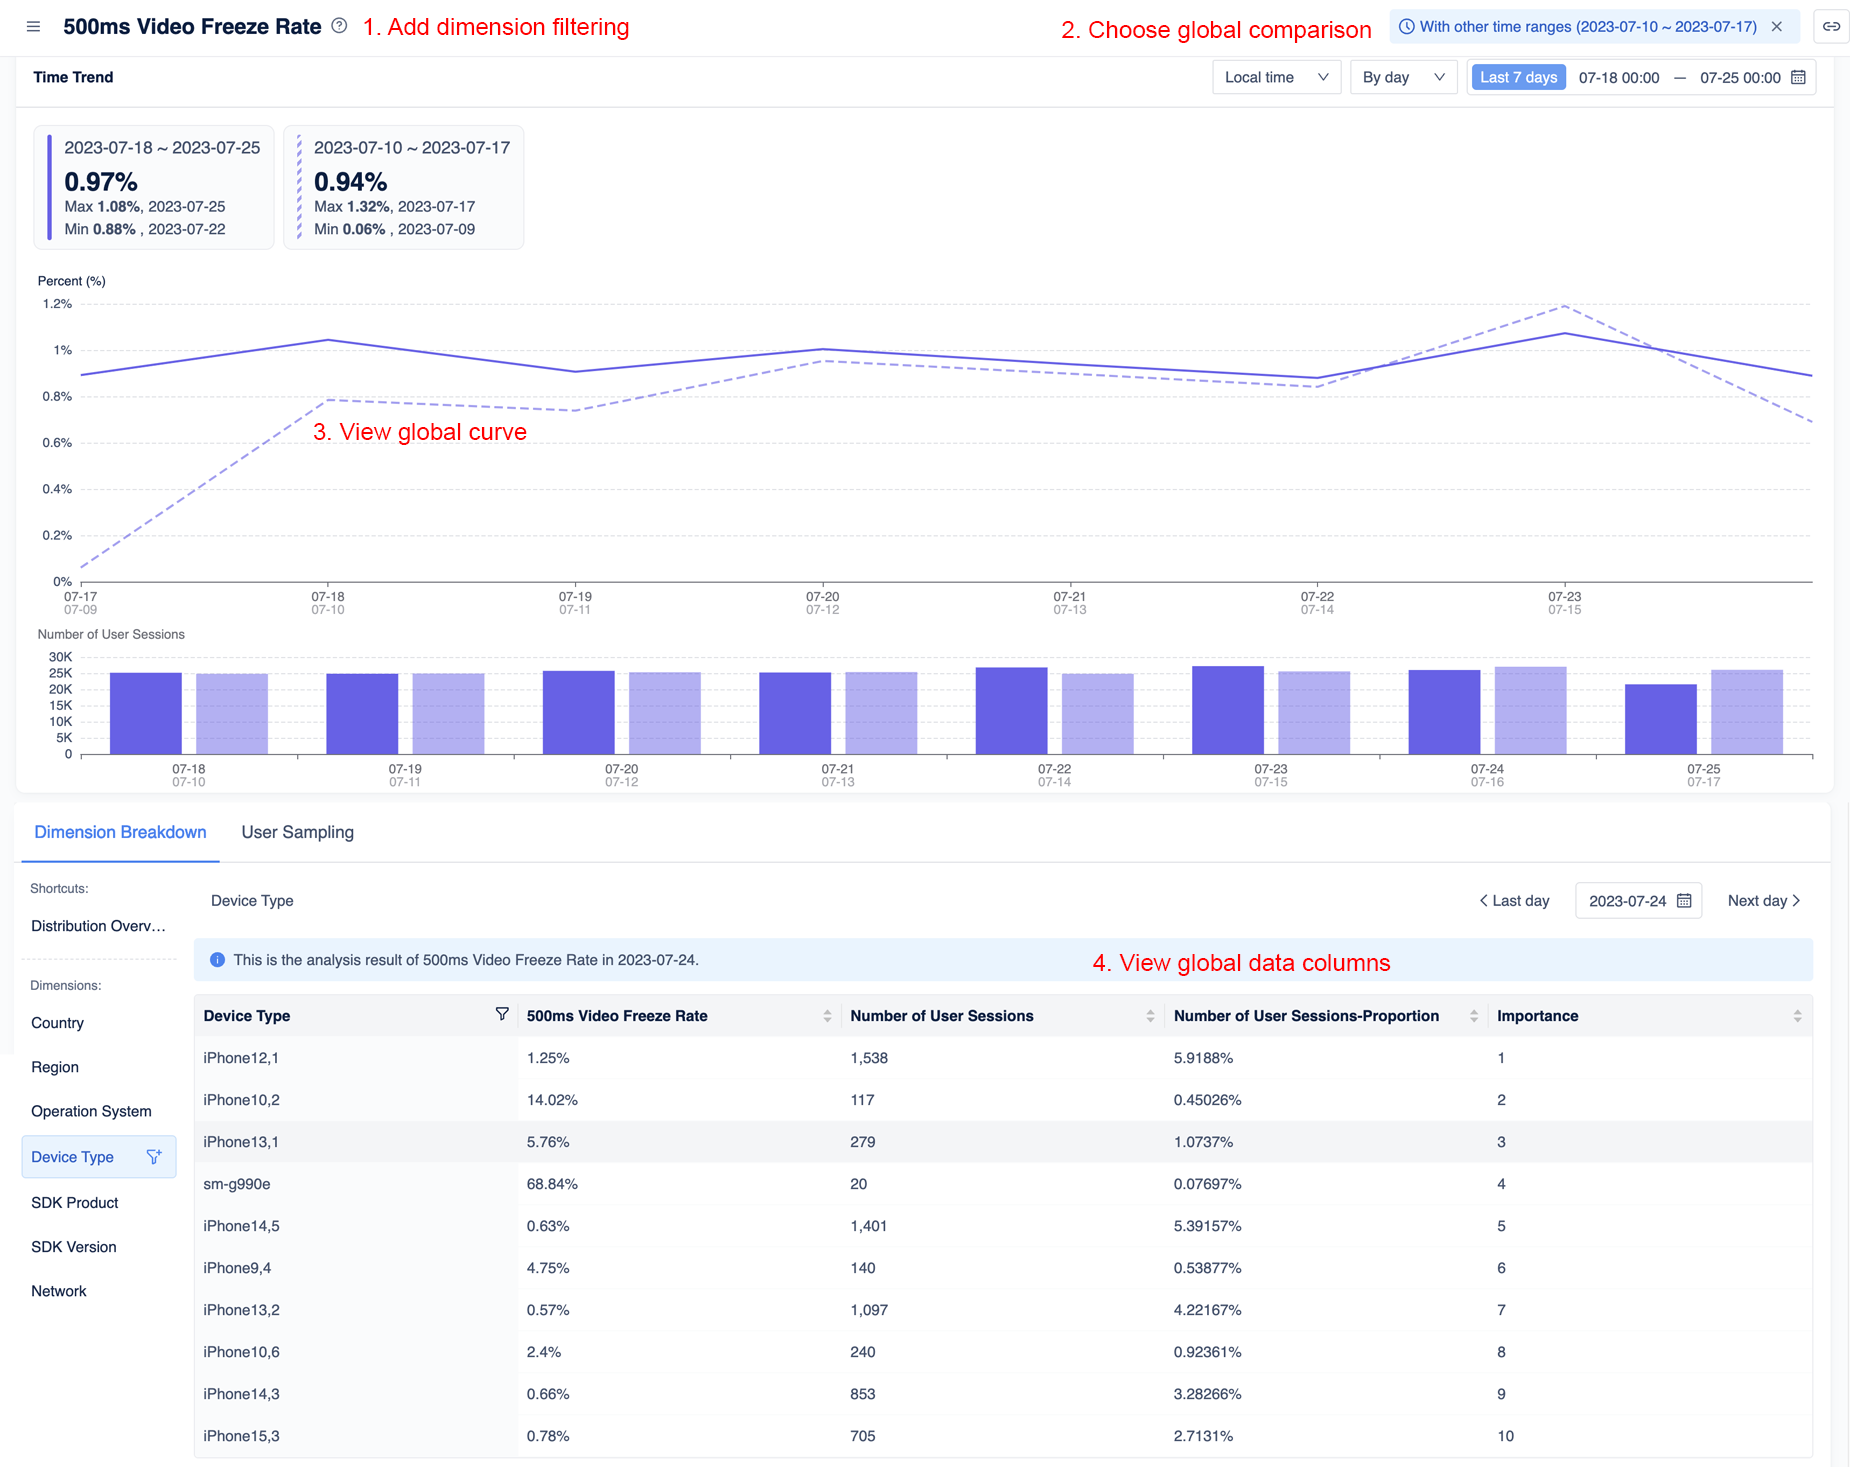
Global comparison
Global comparison is used to compare the results of a certain indicator under dimensional conditions with global results. When using this method, please note that the global comparison only takes effect when the main analysis indicator is selected and the dimension filter condition is added.
Reference
This section contains information that completes the information on this page, or points you to documentation that explains other aspects to this product.
Core indicators
Data Insight plus supports the following core indicators.
| Indicator name | Description |
|---|---|
| Number of calls | A call is counted from the time the first user joins the channel until the last user leaves the channel. Calls is the total number of calls that occurred during the selected time frame. |
| Concurrent calls | A call is counted from the time the first user joins the channel until the last user leaves the channel. Concurrent Calls is the number of simultaneous calls that were made online during the selected time frame. |
| Number of calling users (according to user ID + channel name) | Each user ID + channel name is counted as one user, and the same user repeatedly joining the same channel is counted as one person. The number of users is the total number of users who made calls during the selected time range. |
| Concurrent users | Each user ID + channel name is counted as one user. The number of concurrent users is the number of users who are online at the same time during the selected time frame. |
| 5s join channel success rate | Number of successful channel joins within 5 seconds / number of attempts to join the channel * 100% |
| 500ms video freeze rate | If the frame-free time exceeds 500 ms after the remote video is decoded, it is recorded as a video freeze. Video Freezing Rate = Video Freezing Duration ÷ Video Call Duration × 100% |
| 200ms audio freeze rate | If the frame-free time exceeds 200 ms after receiving the remote audio decoding, it is recorded as an audio freeze. Audio freeze rate = audio freeze duration ÷ audio call duration × 100% |
Other indicators
The following indicators are available in addition to the core indicators.
| Indicator name | Description |
|---|---|
| Number of calling users (by user ID) | Each user ID is counted as one user. The number of users is the total number of users who made calls during the selected time range. |
| Call time | The accumulative duration of calls made by all users using the RTC SDK, in minutes. When audio and video exist at the same time, only the video duration is counted. |
| Video call duration | The accumulative duration of video calls made by all users using the RTC SDK, in minutes. |
| Audio call duration | The accumulative duration of audio calls made by all users using the RTC SDK, in minutes. |
| Active calls | Each time a user enters and exits a channel is counted as one active call, and the same user repeatedly joins the same channel as multiple active calls. Active calls are the total number of sessions that occurred within the selected time frame. |
| 5s join channel success rate | Number of successful channel joins within 5 seconds / number of attempts to join the channel * 100% |
| End-to-end network transmission delay rate | The delay from the sending end to the receiving end through network transmission (excluding network jitter delay) is greater than 400ms, which is recorded as a delay. End-to-end network delay rate = total audio and video network transmission delay time ÷ total audio and video time length * 100% |
| Number of concurrent cloud recording tasks | Each time the method is called start to start cloud recording, a cloud recording task is created. Only displayed when cloud recording is enabled, see cloud recording for details. |
| Enter the maximum number of concurrent tasks for online media streaming | Each time Create the method is called to create a cloud player, an input media stream task is created. Only displayed when inputting online media stream is enabled, see Inputting Online Media Stream for details. |
Dimensions
Select from the following for dimension filtering:
| Dimension name | Description |
|---|---|
| Nation | The user's country. |
| Area | The user's region. |
| Operating system | The operating system used by the user, such as Windows, iOS, etc. |
| Equipment type | The device type used by the user, such as iPad 7.5, etc. |
| SDK products | SDK products used by users for calls, including RTC Native and WebRTC. |
| SDK version | The SDK version used by the user call. |
| Network Type | The network used by the user when calling, such as Wi-Fi, 4G, etc. |