Data Insights
Data Insights are designed to help you understand the usage and quality of calls in your app. You can view their distribution in multiple dimensions with daily and hourly data breakdown.
Getting started
-
Subscribe to a pricing plan to enable the Data Insights feature for your project.
-
Log in to Agora Console and click Agora Analytics on the left navigation bar.
-
Select a project in the top-left corner.
-
Click Usage Insights to view the usage statistics or Quality Insights to view the quality statistics.
-
Configure the data filter:
- Usage Insights: Select the timezone, data granularity, and time frame in the upper-right corner.
![]()
- Quality Insights: Select the product type in the upper-left corner, and the timezone, data granularity, and time frame in the upper-right corner.
![]()
Usage Insights
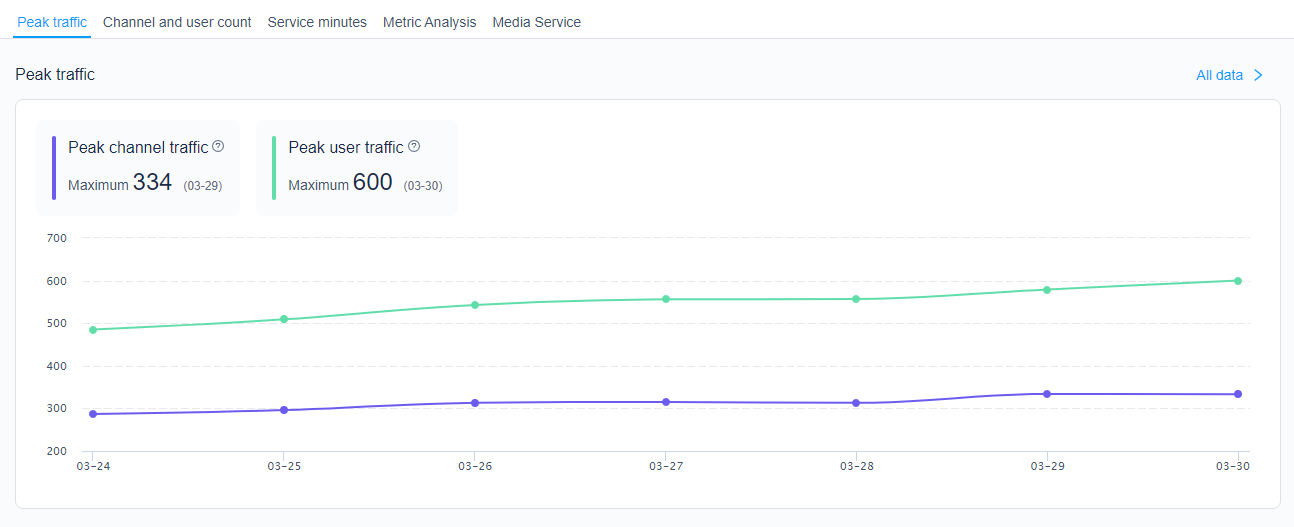
The Usage Insights page presents metrics that can help you locate the dates with abnormalities and understand how usage is distributed in different dimensions.
Peak traffic, Channel and user count, and Service minutes represent the overall trend. In each section, the summary boxes in the upper-left corner highlight the aggregate or peak value of each usage metric, and the line chart in the bottom area shows the daily values of each usage metric. Click All data in the top-right corner of each section to download the data or view it in the table form.
These metrics are described in Usage metrics.
Each line chart provides the following features:
-
Hide and display: To hide or display the line for a usage metric, click on the corresponding summary box.
-
Change time selection: When data granularity is set to By day in the data filter, you can click a data point and select Hourly data, which changes the data granularity to hourly and the time frame to the corresponding hour. To switch back to the original time selection, click Restore filter at the top.
-
Jump to Metric Analysis: To jump to the Metric Analysis panel of a usage metric for a specific day, click the corresponding data point on the line and select Metric Analysis.
Metric Analysis
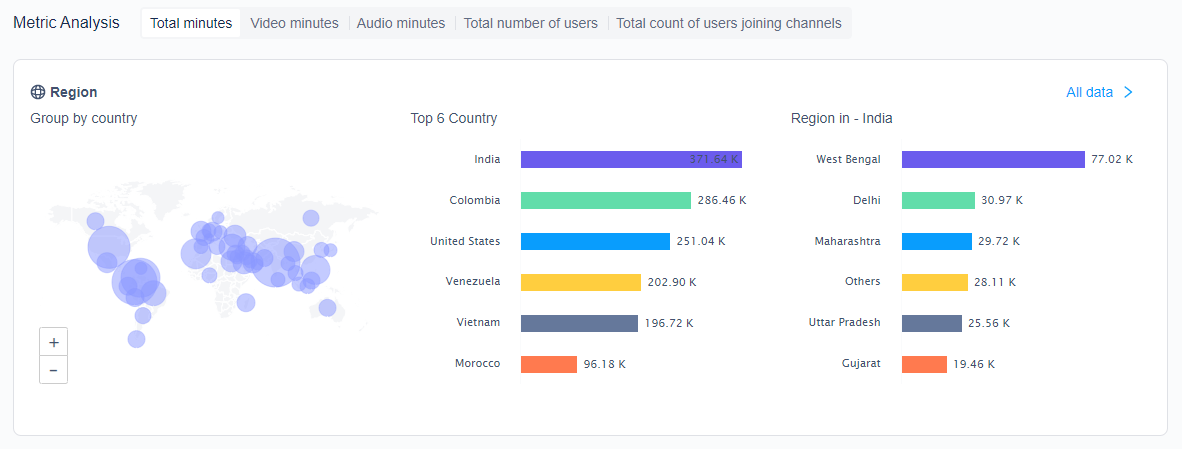
The Metric Analysis panel has six sections: Region, Network type, Operating system, SDK version, Device type, and Channel size. Each section presents the top six values for that dimension in the chart form.
In the top-left corner of the panel, you can select the usage metric you want to view. In the top-right corner of each section, you can click All data to download the data or view it in the table form.
The six dimensions are described in Dimensions.
Media Service
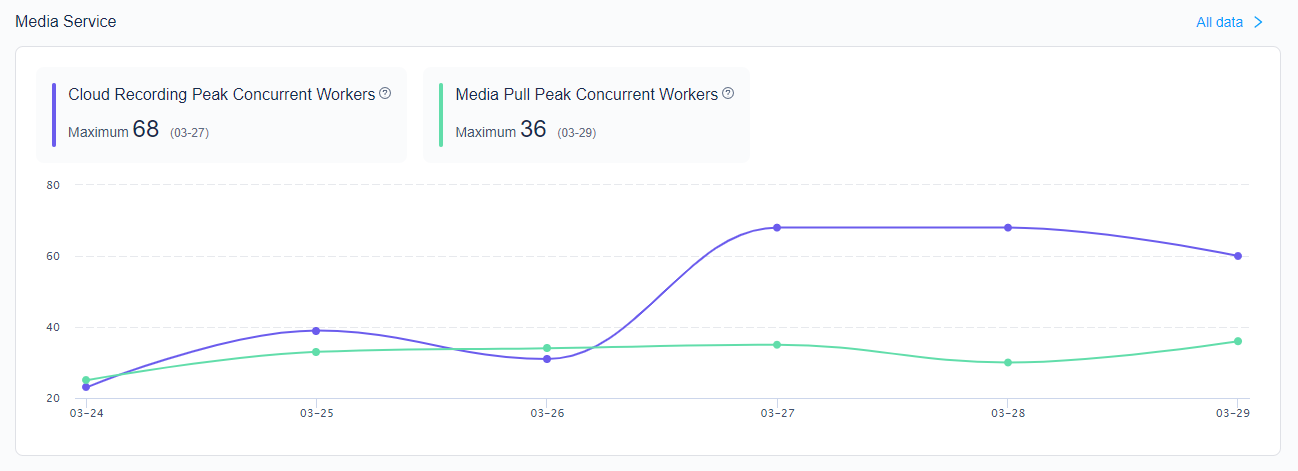
The Media Service panel presents peak numbers for Cloud Recording and Media Pull concurrent workers in the line chart form. Hover over a data point to see the value and its change compared to the previous week. The summary boxes in the upper-left corner highlight maximum values.
Quality Insights
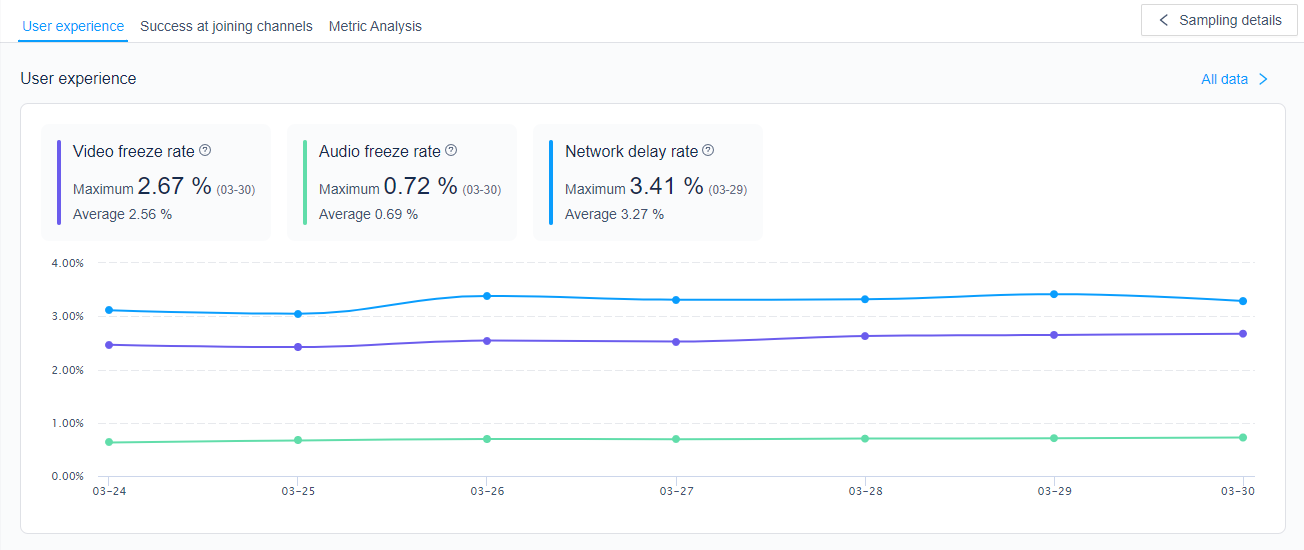
The Quality Insights page presents metrics that can help you locate the dates and hours with abnormalities and understand how quality is related to usage in different dimensions.
The User experience and Success at joining channels panels represent the overall trend. In each section, the summary boxes in the upper-left corner highlight the peak or bottom value of each quality metric, and the line chart in the bottom area shows the daily or hourly values of each quality metric. You can click All data in the top-right corner of the section to download the data or view it in the table form.
The quality metrics are described in Quality metrics.
Each line chart provides the following features:
-
Hide and display: To hide or display the line for a quality metric, click on the corresponding summary box.
-
Change time selection:
-
When data granularity is set to By day in the data filter, you can click a data point and select Hourly data, which changes the data granularity to hourly and the time frame to the corresponding hour. To switch back to the original filter setting, click Restore filter at the top.
-
When data granularity is set to By hour in the data filter, you can click a data point and select Minutely data, which changes the data granularity to by minute and the time frame to the corresponding minute. To switch back to the original filter setting, click Restore filter at the top.
-
-
Jump to Metric Analysis: To jump to the Metric Analysis panel of a quality metric for a specific day or hour, click the corresponding data point on the line and select Metric Analysis.
Additionally, the line chart for User experience provides the data sampling feature:
-
Channel data sampling: When data granularity is set to By day or By minute, click a data point and select Channel data sampling to view its scatter chart. The X coordinates are described in Quality metrics.
-
User data sampling: On the scatter chart, click a data point and select User data sampling to view the top six users who experience a high freeze rate. To view call quality details about a user, click Call Inspector to use the Call Inspector function.
Metric Analysis
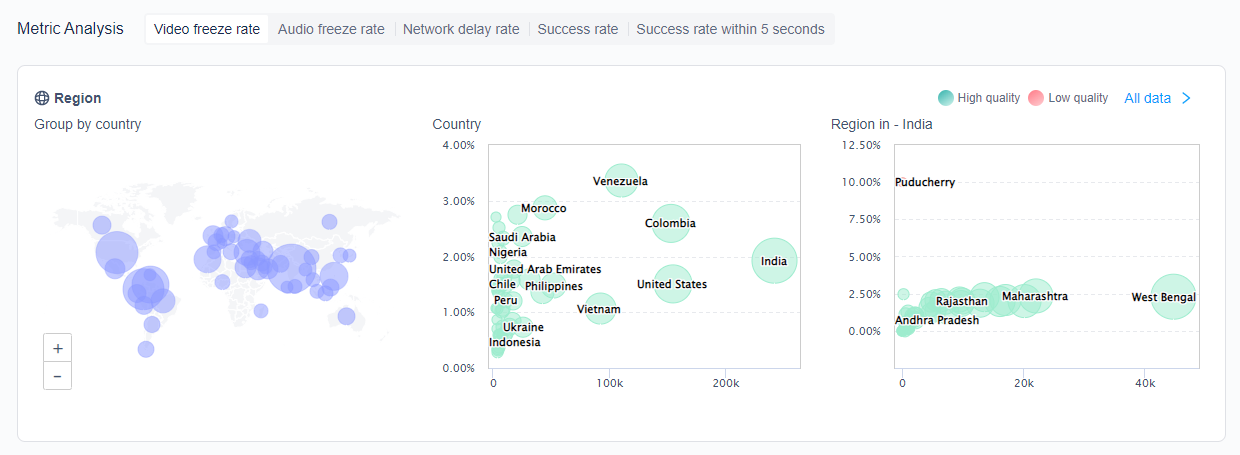
The Metric Analysis panel has six sections: Region, Network type, Operating system, SDK version, Device type, and Channel size. Each section presents the connection between quality and usage in the chart form.
In the top-left corner of the panel, you can select the quality metric you want to view. In the top-right corner of each section, you can click All data to download the data or view it in table form.
The six dimensions are described in Dimensions.
In the country and region bubble charts, the Y coordinate is the value of the selected metric, and the corresponding X coordinate is listed in Quality metrics. The bubble color represents whether the metric value is normal. The bubble turns red if one of the following occurs:
- The video freeze rate exceeds 5%.
- The audio freeze rate exceeds 3%.
- The network delay rate exceeds 10%.
- The success rate of users joining channels is below 95%, or the success rate of users joining channels within 5 seconds is below 95%.
Key terms
This section describes the key terms used in Data Insights. See Agora Key Terms for more key terms.
Channel
Every audio or video call happens in a channel. If an app is a building, a channel is a room in the building.
Data Insights does not count a channel by name, but by lifecycle. A channel is counted once for each period of time between when the first user joins it until the last user leaves it. That is, it is not counted when there are no users.
User
Each user in a channel is identified by a unique user ID. There can never be two identical user IDs in a channel.
Data Insights counts each instance of a unique user ID. If a real-life user joins one channel using multiple user IDs, or joins multiple channels using one user ID, Data Insights counts the user in both situations as multiple users.
Usage metrics
| Usage metric | Description |
|---|---|
| Peak channel traffic | The maximum number of channels in use. |
| Peak user traffic | The maximum number of in-call users across all channels. |
| Total number of channels | A channel is counted once for each period of time between when the first user joins it until the last user leaves it. |
| Total number of users | The number of users across all channels. A user joining one channel using multiple user IDs or joining multiple channels using one user ID is counted multiple times. |
| Total count of users joining channels | Each time any user ID joins any channel is counted. |
| Total minutes | The total duration of video and audio-only calls calculated by the number of users. |
| Video minutes | The total duration of video calls calculated by the number of users. |
| Audio minutes | The total duration of audio-only calls calculated by the number of users |
Quality metrics
| Quality metric | Description | X coordinate in scatter chart |
|---|---|---|
| Video freeze rate | The rate at which video freezing occurs, which equals Total video freeze time ÷ Total video minutes calculated by the number of streams①. Only video freezes longer than 600 milliseconds are counted. | Total video minutes calculated by the number of streams |
| Audio freeze rate | The rate at which audio freezing occurs, which equals Total audio freeze time ÷ Total audio minutes calculated by the number of streams. Only audio freezes longer than 200 milliseconds are counted. | Total audio minutes calculated by the number of streams |
| Network delay rate | The rate at which network delay occurs, which equals Total end-to-end network delay ÷ Total audio and video minutes calculated by the number of streams. Only end-to-end network delays longer than 400 milliseconds are counted. | Total audio and video minutes calculated by the number of streams |
| Success rate of users joining channels | The rate at which users attempting to join any channel succeed, which equals Number of users who have joined ÷ Number of attempts to join | Number of attempts to join a channel |
| Success rate of users joining channels within 5 seconds | The rate at which users attempting to join any channel succeed within 5 seconds, which equals Number of users who have joined within 5 seconds ÷ Number of attempts to join | Number of attempts to join a channel |
Dimensions
| Dimension | Description |
|---|---|
| Geography | The country and region from which the user connects. |
| Network type | The user’s network type, such as Wi-Fi or 4G. |
| Operating system | The user’s operating system, such as Windows or iOS. |
| SDK version | The version number of the SDK that implements the call. |
| Device type | The user’s device type. |
| Channel size | The number of users in the channel. |
Calculating usage by the number of users vs. by the number of streams
There are two different approaches to calculating Video SDK service minutes for a channel: by the number of users in the channel, and by the number of streams each user is subscribed to in the channel. Their difference is described in How does Agora calculate service minutes.
Data sampling criteria
Line charts under the Overall Trend panel on the Quality Overview page support data sampling. The data sampling criteria is defined as follows:
| Line chart | Data sampling criteria |
|---|---|
| Video freeze rate | The video freeze rate exceeds 5%, and the video minutes across all channels exceed 100 in one minute. |
| Audio freeze rate | The audio freeze rate exceeds 3%, and the audio minutes across all channels exceed 100 in one minute. |
| Network delay rate | The network delay rate exceeds 10%, and the total minutes across all channels exceed 100 in one minute. |